Overall auto sales were up almost 40 per cent over Q1, with most provinces showing less than a percentage point of change for ZEV market share
Overall auto sales were up almost 40 per cent, with most provinces showing less than a percentage point of change for ZEV market share
The second quarter of 2026 was good for Canadian auto sales, with a 37.7 per cent increase over those in Q1.
The latest data from Statistics Canada shows that Canadians registered 547,673 new vehicles from April to June this year compared to 397,601 in Q1. Of those Q2 registrations, 58,811 were classed as ZEVs.
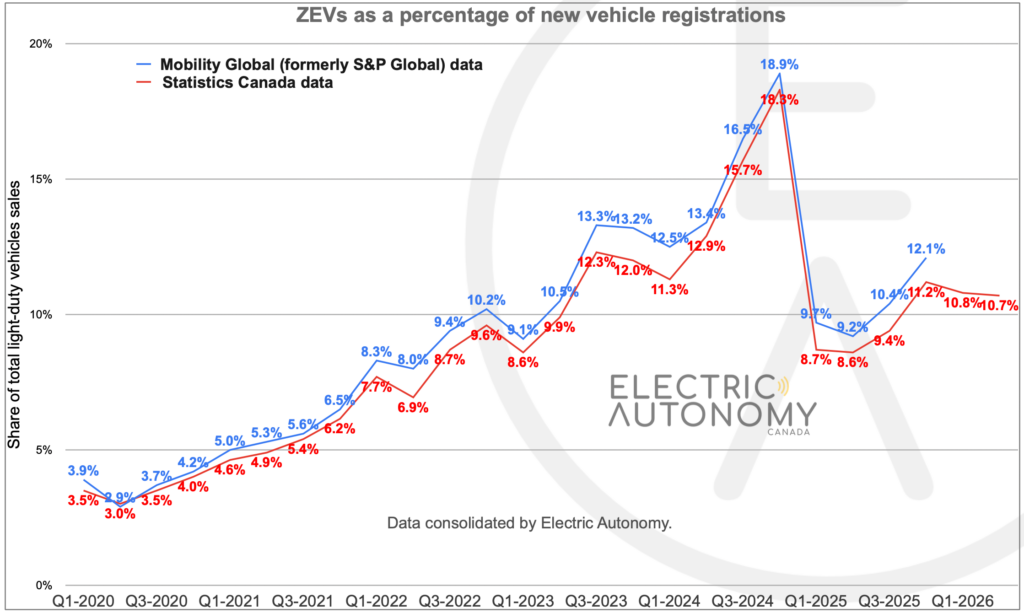
However, despite the increase in units sold, market share for zero-emission vehicles (ZEVs), remained almost unchanged at 10.7 per cent, compared with 10.8 per cent in Q1.
Battery-electric vehicles (BEVs) again made up most of those Q2 ZEV sales across Canada at 40,585 units, for a market share of 7.4 per cent. That is a tick down from the 7.5 per cent share in Q1.
Plug-in hybrid electric vehicles had 18,226 sales in Q2, making up 3.3 per cent of the market — identical to its Q1 percentage.
(Note: StatsCan classifies BEVs and PHEVs as “zero-emission vehicles.” This grouping does not reflect Electric Autonomy’s policy, which considers only non-combustion engine vehicles as zero-emission. However, where statistics refer to ZEVs, we have adhered to StatsCan’s definition for consistency.)
The 547,673 in overall vehicle sales is close to the 541,896 registered in Q2 of 2025. A year ago, however, ZEV market share was just 8.6 per cent, with original Canadian EV rebates having ended earlier in 2025.
Provincial tallies
Almost all provinces and territories remained within or close to a percentage point of ZEV market share between Q1 and Q2.
British Columbia once again leads Canada at 18.7 per cent market share. That’s down from 19 per cent last quarter.
Quebec’s ZEV share rose to 17.8 per cent, up from 17.6 per cent last quarter.
The province is joined only by New Brunswick and Northwest Territories for rising ZEV market shares across the country.
N.B. went from 4.9 per cent in Q1 to 5.3 in Q2, while N.W.T. rose from 1.0 per cent last quarter to 1.3 per cent.
| Region | Q2 Total sales | Q2 ZEV sales | Q2 ZEV % | Q1 ZEV % |
| Canada | 547,673 | 58,811 | 10.7 | 10.8 |
| Que. | 133,317 | 23,701 | 17.8 | 17.6 |
| B.C. | 61,544 | 11,493 | 18.7 | 19.0 |
| Ont. | 208,445 | 17,142 | 8.2 | 8.2 |
| Sask. | 15,813 | 416 | 2.6 | 2.9 |
| Man. | 16,201 | 977 | 6.0 | 7.7 |
| N.B. | 12,742 | 677 | 5.3 | 4.9 |
| N.S. | 18,026 | 870 | 4.8 | 5.4 |
| P.E.I. | 2,173 | 140 | 6.4 | 7.5 |
| Nunavut | 50 | 0 | 0 | 0 |
| N.W.T. | 538 | 7 | 1.3 | 1.0 |
| Yukon | 694 | 19 | 2.7 | 6.6 |
The ZEV market share of Ontario, with the most overall vehicle registrations in the country at 208,445, remained unchanged at 8.2 per cent.
Yukon had the largest drop, going from 6.6 per cent in Q1 down to 2.7 per cent in Q2. However, low sales can create artificial percentage swings: in terms of registered units, that was a difference of 28 in Q1 down to 19 in Q2.
StatsCan does not have figures for Alberta or Newfoundland and Labrador because of contractual limitations of the existing data sharing agreement. However, they are included in the Canadian totals.
Data from Statistics Canada is compiled solely from new vehicle registration records from provinces and territories.
Electric Autonomy prefers quarterly sales data over monthly statistics to show a broader trend in sales, rather than individual spikes and valleys. Market share over sales numbers is also a better indicator of ZEV adoption in Canada.